Table of contents
- What is product analytics?
- Why is product analytics important?
- What are the most important product analytics metrics with examples?
- 1. Customer journey analysis
- 2. Funnel analysis
- 3. Attribution analysis
- 4. Cohort analysis
- 5. Retention analysis
- 6. Churn analysis
- 7. Feature adoption analysis
- 8. AI insights
- How do I choose the right product analytics for my situation?
- In a nutshell
- FAQs
Everything you need to know about product analytics
May 15, 2024
20 mins read

Have you noticed why some apps are super easy to use while others leave you scratching your head?
How do features you never touch keep getting updates?
There's a secret behind great apps, and it's called product analytics.
Today, we'll show you how apps collect user data and how data turns into magic.
This information helps businesses truly understand users, improve their apps, and develop products people love.
So, if you're interested in how apps work, or even if you just build cool things yourself, this blog is for you!
We'll make you a product analytics pro in no time.
What is product analytics?
Product analytics is all about understanding how users interact with a digital product. This process involves tracking, analyzing, and visualizing user behavior data to gain insights that can be used to improve the product.
Product analytics involves understanding the "why" behind user behavior in your SaaS application. It's not about magic but about gathering data on how people use your software.
Why is product analytics important?
Understanding how users interact with your software is no longer optional; it's essential.
Product analytics data can include things like:
- User activity: How often do users log in and use your app?
- Feature usage: Which features are most popular, and which ones are rarely used?
- User journey: How do users flow through your app? Do they face any roadblocks or confusing sections?
By analyzing this data, you can gain valuable insights into your user base. This allows you to:
- Improve user experience (UX): Is a specific screen causing frustration? Product analytics can help identify these pain points so you can make improvements.
- Develop features users want: The data might show a high demand for a specific feature, prompting you to prioritize its development.
- Boost retention and growth: Are users dropping off after completing a specific task? Product analytics can help you understand and address the issue.
Here's why product analytics is so important:
- Data-driven decisions: Stop guessing what users need and start making decisions based on concrete data.
- Increased user satisfaction: By improving user experience and addressing pain points, you can create more enjoyable and productive software for your customers.
- Prioritized development: Focus your development efforts on features that users actually need and use.
- Competitive advantage: Understanding how users interact with your app compared to competitors allows you to differentiate yourself in the market.
What are the most important product analytics metrics with examples?
Understanding how users interact with your product, from initial discovery to ongoing use, is crucial for success. Here's a breakdown of essential metrics we need to analyze to understand user behavior and drive conversions.
1. Customer journey analysis
Customer journey analysis is a powerful tool for understanding users' entire experience with your product, from the first moment they use it to their ultimate goal. It's like mapping a user's adventure, uncovering potential roadblocks and hidden treasures along the way.
Let’s see what customer journey analysis entails and how it benefits your business:
Mapping the user's path
Customer journey analysis traces the user's path starting at the point they encounter it for the first time. This "first touchpoint" could be anything – seeing an ad online, visiting your website, or hearing a friend's recommendation. The analysis then tracks their progress through various stages, such as:
- Awareness: Users become aware of your product's existence, perhaps through marketing campaigns or organic discovery.
- Consideration: They learn more about your product by researching features, benefits, and pricing.
- Decision: Users weigh their options and decide whether to try your product or a competitor's.
- Acquisition: They sign up for a free trial, download the app, or make a purchase.
- Onboarding: Users learn the ropes and explore the functionalities of your product.
- Engagement: They actively use your product and derive value from its features.
- Retention: Users continue using your product long-term, potentially becoming loyal customers.
- Advocacy: Satisfied users recommend your product to others, becoming brand champions.
Identifying friction points
Customer journey analysis isn't just about mapping the path; it's about identifying roadblocks. By analyzing user behavior at each stage, you can pinpoint where users get stuck, frustrated, or abandon their journey altogether. This could be due to:
- Confusing website navigation
- Unclear product information
- A complex signup process
- Lack of engagement during onboarding
- Difficulties using certain features
Finding improvement opportunities
Once you identify pain points in the user journey, you can take action to smoothen the path. Here's how customer journey analysis empowers you:
- Optimize your website: Improve user interface (UI) clarity and streamline the navigation to make finding information effortless.
- Enhance product information: Craft clear and compelling product descriptions, FAQs, and tutorials to guide users effectively.
- Simplify the signup process: Reduce unnecessary steps and make signing up for your product quick and painless.
- Personalize the onboarding experience: Tailor product onboarding based on user needs to ensure a smooth and engaging first interaction with your product.
- Address usability issues: Identify and resolve difficulties users face while using specific features within your product.
For instance, Usermaven recently updated its website to provide a more professional UI/UX experience and functionalities.
The benefits of knowing your users
By understanding the user journey, you gain a deeper understanding of your target audience and their needs. This knowledge translates to several advantages:
- Improved user experience
- Increased conversions
- Enhanced marketing efforts
- Boosted customer loyalty
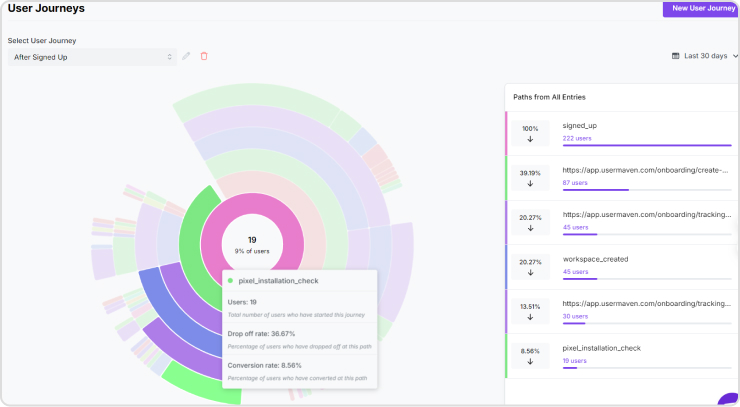
Example: Many product analytics tools like Usermaven tracks user interactions throughout the journey. You can see which features they use, where they hesitate, and if they complete desired actions. This data helps pinpoint friction points and optimize the journey for a smoother experience.
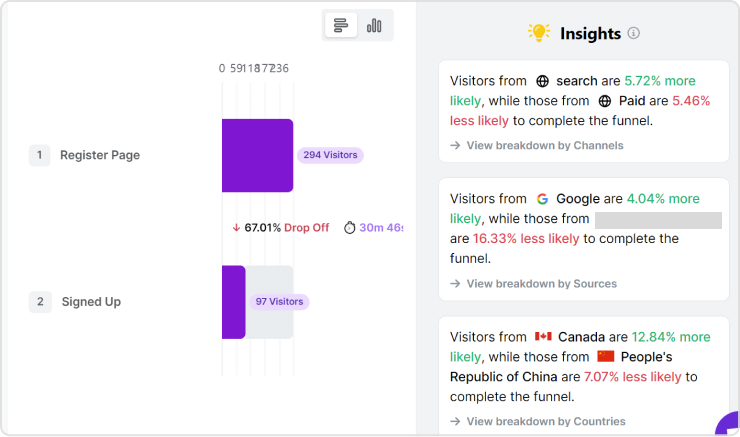
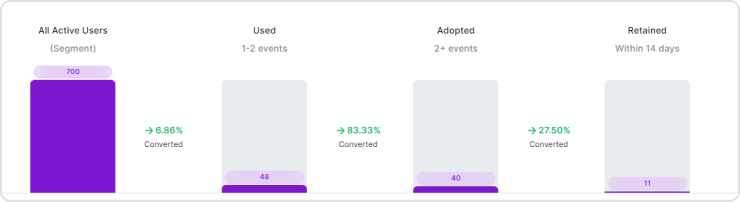
2. Funnel analysis
Funnel analysis is used to understand how users navigate toward a desired action on your website, app, or any digital platform. Like a real funnel, wide at the top and narrowing towards the bottom. In funnel analysis, users enter at the top, representing their initial interaction (e.g., landing on a product page). Ideally, they progress through a series of steps and convert at the bottom by taking a specific action (e.g., completing a purchase).
Key aspects of funnel analysis
- Visualizing the user journey: The funnel metaphor perfectly captures the user flow. A larger number of users enter at the top, and as they progress through steps, the number typically decreases. This helps visualize where users are dropping off and identify potential roadblocks.
- Identifying drop-off points: Funnel analysis is particularly insightful because it reveals where users abandon the process. Did they exit the website after viewing a product or maybe after adding it to the cart? By pinpointing these drop-off points, you can diagnose issues specific to each stage.
- Optimizing for conversions: The ultimate goal is to increase conversions, which is the desired action users take at the end of the funnel (e.g., making a purchase and signing up for a newsletter). By understanding where users fall off, you can optimize each stage to improve the flow and encourage them to continue down the funnel.
Real-world examples
- E-commerce website: The funnel might track users from product discovery (landing page) to adding items to the cart, proceeding to checkout, and finally completing the purchase.
- Mobile app: An app onboarding funnel might track users from downloading the app to signing up, completing a tutorial, and ultimately engaging with the core features.
- Marketing campaign: A funnel could track users clicking on an ad, visiting a landing page, watching a video, and then subscribing to a service.
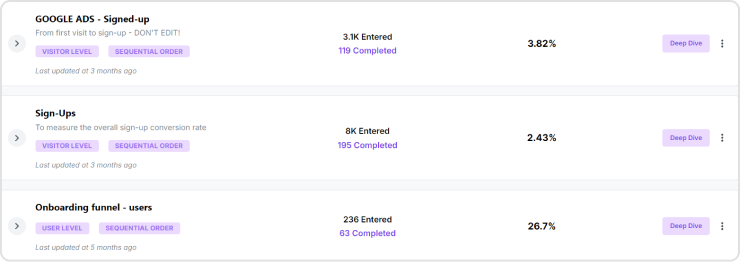
Example: Usermaven lets you define conversion funnels for different actions within your app. You can track user behavior at each stage, identify drop-off points, and pinpoint areas for improvement to maximize conversions.
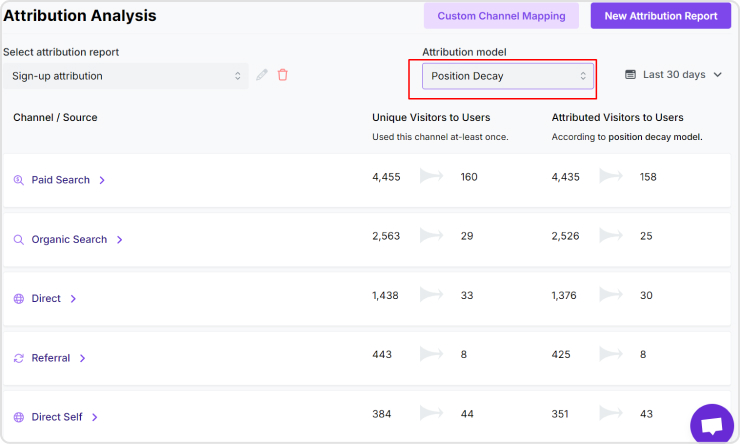
3. Attribution analysis
Understanding which channels are driving the most conversions (customer actions) is crucial. This is where attribution analysis steps in. It's a detective game for marketers, helping them identify the marketing touchpoints that influence users throughout their journey toward conversion.
Imagine a user sees a social media post about your product (touchpoint 1), then clicks on a banner ad a few days later (touchpoint 2), and finally makes a purchase on your website (conversion). Attribution analysis helps you determine how much credit each touchpoint deserves for that conversion.
A deeper dive into attribution analysis
- Marketing management: Today's marketing landscape is a complex mix of channels: social media, email marketing, paid search ads, content marketing, and more. Users often interact with multiple channels before converting, making it challenging to pinpoint which one deserves the most credit.
- Analyzing the web: Attribution analysis tackles this challenge by assigning credit (or weight) to each touchpoint a user interacts with on their path to conversion. This allows you to see the bigger picture and understand which channels are truly influencing user behavior.
- Making informed decisions: With insights from attribution analysis, you can make informed decisions about your marketing budget allocation. By identifying the high-performing channels, you can invest more resources where they'll yield the most conversions and optimize your overall marketing strategy.
Popular attribution models
- First interaction model: This model assigns all credit to the first channel a user interacts with. Similar to the last interaction model, it might overlook the cumulative impact of subsequent touchpoints.
- Last interaction model: This simple model gives all the credit to the last channel a user interacts with before converting. While easy to understand, it might neglect the influence of earlier touchpoints.
- Time decay model: This model distributes credit across all touchpoints a user encounters, with more weight given to interactions closer to the conversion. It offers a more balanced perspective but can be complex to implement.
Related: Multi-touch attribution: What is it & how do you use it?
- Position-based model: This model assigns a predetermined weight to specific positions in the user journey (e.g., the first touchpoint gets 40%, the last touchpoint gets 40%, and the middle gets 20% share).
By implementing attribution analysis, you gain a deeper understanding of:
- Customer journey: How users interact with your brand across various channels.
- Channel effectiveness: The true impact of each marketing channel on conversions.
- Marketing ROI: The return on investment for your marketing efforts.
As marketing strategies evolve and user behavior changes, it's essential to regularly evaluate and refine your attribution model to ensure you're making the most of your marketing budget.
Example: Usermaven integrates with various marketing platforms, allowing you to see which channels bring users in and how they convert within your app. This data helps you optimize your marketing strategy and invest in channels with the highest return on investment (ROI).
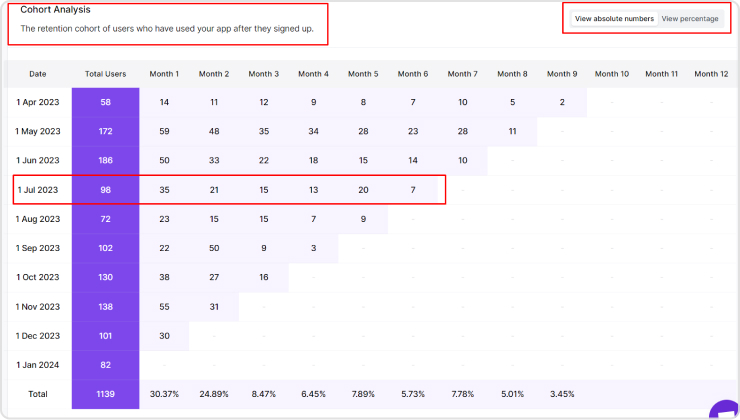
4. Cohort analysis
While funnel analysis examines how users navigate a specific journey (e.g., checkout process), cohort analysis takes a broader perspective. It allows you to understand how different groups of users, called cohorts, interact with your product or service over extended periods.
Imagine a large group of people who share a common characteristic, like signing up for your service in a specific month (signup date cohort) or subscribing to a particular plan (plan type cohort). Cohort analysis tracks how these groups behave over time, revealing valuable insights into user engagement and retention.
Key aspects of cohort analysis
- Grouping by shared characteristics: The power of cohort analysis lies in segmenting users based on shared traits. This could be the signup date, location, demographics, acquisition channel, or any other relevant data point. Grouping users by these characteristics allows you to compare and identify patterns specific to each segment.
- Tracking behavior over time: Cohort analysis goes beyond a single snapshot. It tracks how users within a cohort interact with your product over time. This could involve metrics like login frequency, feature usage, purchase history, or any other relevant action. By observing these trends, you can understand how user behavior evolves within a specific group.
- Identifying trends and patterns: The purpose of cohort analysis is to uncover trends and patterns within each cohort. For instance, you might observe that a cohort acquired through social media shows a higher churn rate (cancellation) compared to those acquired through email marketing. These insights empower you to tailor your strategies to address the specific needs of each user segment.
Real-world examples of cohort analysis
- E-commerce platform: Analyze how signup cohorts (users who signed up in a specific month) behave over time. You might identify a decline in purchase frequency for a specific cohort, prompting you to investigate and potentially launch targeted re-engagement campaigns.
- Subscription service: Track how different plan type cohorts (e.g., free vs. paid) engage with features over time. This could reveal that free users rarely upgrade to paid plans, suggesting you re-evaluate your free plan offerings or introduce targeted upgrade incentives.
- SaaS company: Analyze how user cohorts acquired through different marketing channels (e.g., organic search vs. paid ads) retain over time. You might discover that users acquired through organic search have a higher long-term retention rate, prompting you to optimize your content marketing strategy.
As your user base grows and evolves, you'll need to continuously refine your cohorts and the metrics you track. This ensures you're always uncovering the latest trends and patterns shaping user behavior within your product or service.
Example: Usermaven allows you to segment users by various criteria and analyze their behavior as cohorts. This helps you understand how different user groups interact with your app, personalize your approach, and tailor features or marketing messages to their specific needs.
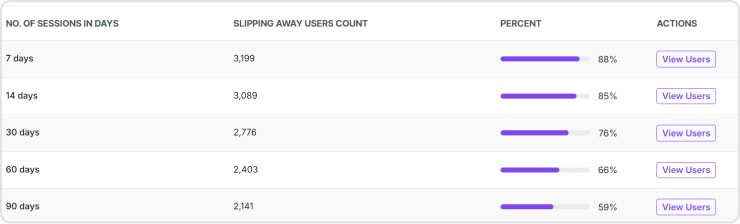
5. Retention analysis
Keeping existing customers is just as important as acquiring new ones. Retention analysis steps in to address this crucial aspect. It's the process of examining user data to understand how well you're retaining customers and identify factors that influence churn (customer cancellation or abandonment).
Imagine a leaky bucket – you can keep pouring new water in (acquiring new customers), but if the leaks are significant (high churn), you'll lose a substantial amount. Retention analysis helps you identify and plug those leaks, ultimately boosting your customer base and revenue.
A deeper dive into retention analysis
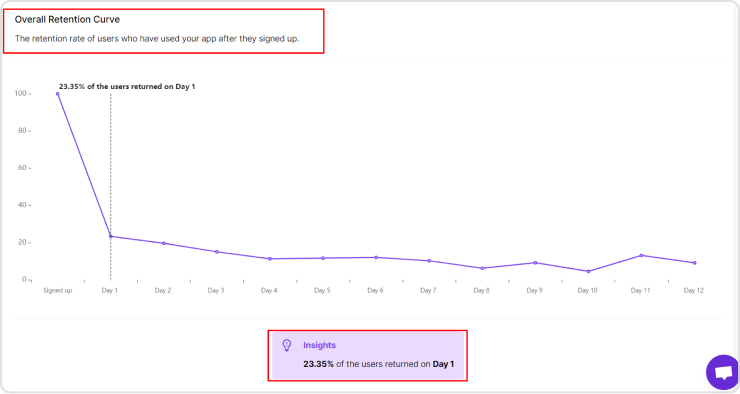
- The retention metric: At the heart of retention analysis lies the concept of the customer retention rate. This metric calculates the percentage of customers who remain active within a specific timeframe (e.g., one month, one year). A high retention rate indicates successful customer engagement and satisfaction, while a low rate signifies a need to address potential issues leading to churn.
- Beyond the numbers: Retention analysis goes beyond simply calculating a rate. It delves deeper to understand the "why" behind customer churn. This involves analyzing user behavior, pinpointing common drop-off points, and gathering user feedback. By understanding the reasons for churn, you can develop strategies to address them and improve customer retention.
- Segmentation for insights: Just like in cohort analysis, segmentation plays a vital role in retention analysis. You can segment your customer base by various factors like demographics, purchase history, usage patterns, or acquisition channels. This allows you to identify specific user groups at higher risk of churn and tailor retention efforts accordingly.
Here are some key benefits of implementing retention analysis:
- Improved customer lifetime value: By retaining customers longer, you increase their lifetime value (total revenue generated over their relationship with your business).
- Reduced customer acquisition costs: Retaining existing customers is generally cheaper than acquiring new ones.
- Enhanced brand loyalty: A focus on retention fosters positive customer experiences, leading to increased brand loyalty and advocacy.
Real-world examples of retention analysis
- Subscription service: Analyze churn rates for different customer segments (e.g., free vs. paid plans). This might reveal that free users churn at a higher rate, prompting you to introduce targeted incentives for conversion to paid plans.
- E-commerce platform: Track user engagement after their first purchase. You might identify a drop-off in repeat purchases, prompting you to implement email marketing campaigns with personalized recommendations or loyalty programs to encourage further engagement.
- SaaS company: Analyze usage patterns of new users. This could reveal features with high abandonment rates, indicating a need for improved user onboarding or in-app tutorials to address pain points and prevent early churn.
As your business evolves and customer needs change, it's crucial to continually monitor churn rates, analyze user behavior, and refine your retention strategies to ensure long-term customer success.
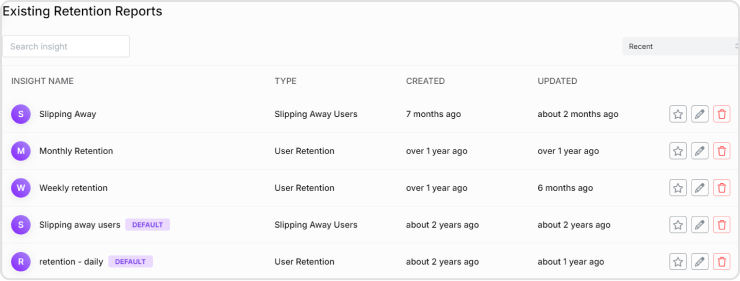
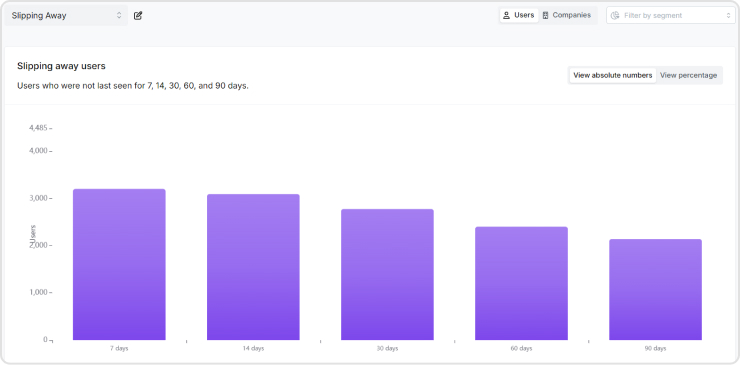
Example: Usermaven helps you track user retention rates over time and analyze user behavior before churn. This allows you to identify potential pain points and proactively address them to keep users engaged and coming back for more.
6. Churn analysis
When we talk about mobile apps, user retention is paramount. Here's where churn analysis steps in, acting as a powerful tool to understand why users leave your app and how to prevent it. It's not just about calculating churn rates – it's about uncovering the "why" behind user loss and using that knowledge to strategically improve your app and user experience.
Key aspects of churn analysis
Churn analysis goes beyond a single metric. It's a multifaceted approach that delves into various data points to paint a clear picture of user behavior and identify potential churn triggers. Here are some key areas churn analysis explores:
- User segmentation: Not all users are created equal. Churn analysis allows you to segment your user base by demographics, usage patterns, or in-app behavior. This helps identify groups with higher churn rates and tailor your efforts accordingly.
- User journey analysis: By mapping the typical user journey within your app, churn analysis can pinpoint specific stages where users drop off. This could be during onboarding, when encountering a confusing feature, or when experiencing a bug.
- User feedback analysis: Direct user feedback, gathered through surveys, app store reviews, or in-app feedback mechanisms, provides valuable insights into user frustrations and areas for improvement. Churn analysis helps you categorize and analyze this feedback to identify recurring themes related to churn.
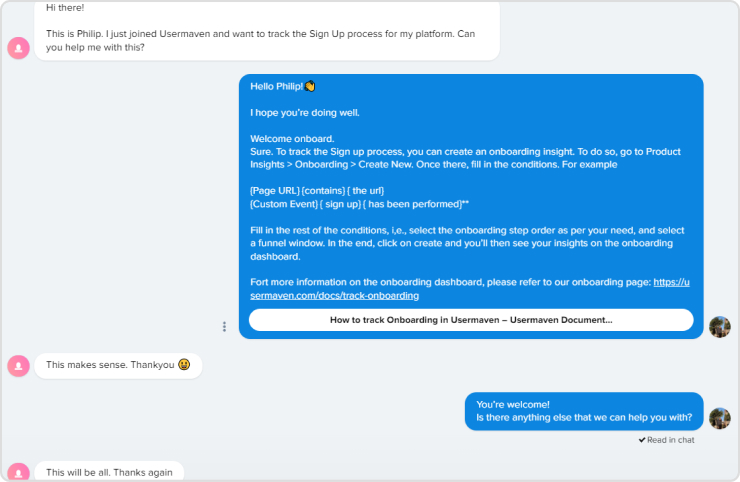
Below is an example of a query we received about onboarding. A new customer sought guidance on tracking their "Sign Up" process.
- Engagement metrics: Engagement metrics like daily active users (DAU), session length, and feature usage can reveal patterns in user behavior. Churn analysis can identify a decline in engagement preceding churn, allowing you to intervene before users completely abandon the app.
- Event analytics: Tracking specific user actions within your app can provide crucial clues. Churn analysis can help you identify events that often precede churn, such as failed login attempts or difficulty completing a core task.
Transform insights into action
Churn analysis empowers you to develop targeted strategies to address user pain points and improve app usability. Here's how:
- Onboarding optimization: A smooth and engaging onboarding experience is crucial for user retention. Churn analysis can help identify areas within onboarding that are confusing or frustrating, allowing you to optimize the process and increase user activation.
- Feature prioritization: By understanding which features users engage with most, churn analysis helps you prioritize development efforts. This ensures you're focusing on features that provide the most value and keep users coming back.
- Personalized engagement: Churn analysis can help you identify users at risk of churning based on their behavior. This allows you to implement targeted engagement strategies, like personalized notifications or in-app messages, to re-engage them and address their specific needs.
- Bug fixes and performance optimization: Technical issues like bugs, crashes, or slow loading times can significantly impact user experience and lead to churn. Churn analysis can help identify these issues and prioritize fixing them to create a more seamless user experience.
The continuous cycle of improvement
Churn analysis is not a one-time fix. It's an ongoing process that fuels continuous improvement. By consistently monitoring churn rates, analyzing user data, and implementing data-driven changes, you can create a positive feedback loop. This loop allows you to refine your app, improve user retention, and ultimately achieve long-term success.
Example: Usermaven helps you analyze user behavior leading up to churn. You can see which features users stopped using or what actions they took before canceling. This data empowers you to identify reasons for churn, address them strategically, and win back lost users.
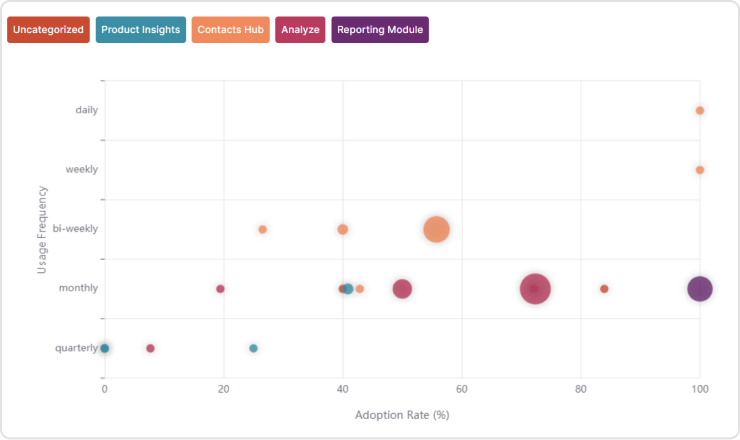
7. Feature adoption analysis
In product development, simply launching a new feature isn't enough. You need to understand how users interact with it – are they finding it valuable? Are they even aware it exists? This is where feature adoption analysis comes in. It's a comprehensive process that helps you measure user engagement with new features and identify areas for improvement.
Why does feature adoption analysis matter?
What if you utilized all your time, energy, and resources in a new feature and found that users are barely using it? Feature adoption analysis helps you avoid this scenario by providing valuable insights into:
- User awareness: Are users even aware the feature exists? This could be due to a lack of promotion within the app, unclear user interface elements, or inadequate onboarding.
- Engagement levels: How many users are actually trying out the new feature? Are they using it regularly, or just dabbling once and abandoning it?
- User behavior: How are users interacting with the feature? Are they completing intended tasks or encountering difficulties? Feature adoption analysis can help identify usability issues or unexpected user flows.
- Impact on the overall product: Is the new feature enhancing the user experience as intended? Is it leading to increased user satisfaction or achieving the desired goals?
By analyzing these aspects, you gain a clear picture of how your new feature is performing. This knowledge allows you to make informed decisions about
- Optimizing the feature: If there are usability issues or areas for improvement, feature adoption analysis can help pinpoint them, enabling you to refine the feature for a better user experience.
- User education: Are users simply unaware of the feature's value? Feature adoption analysis can help identify a need for better in-app tutorials, tooltips, or contextual nudges to guide users toward the new feature.
- Future feature development: By understanding which features users engage with most, you can prioritize future development efforts. This ensures you're focusing on features that provide the most value and keep users coming back.
Measuring feature adoption
So, how do you actually measure feature adoption? Here are some key metrics to track:
- Feature awareness rate: The percentage of users who have encountered the new feature (e.g., viewed the landing page, received a notification).
- Activation rate: The percentage of users who have actively engaged with the new feature after initial exposure.
- Retention rate: The percentage of users who continue using the feature over time. This indicates the long-term value and user stickiness of the feature.
- Usage frequency: How often are users interacting with the feature? This can be measured by sessions per user, time spent using the feature, or specific actions performed within the feature.
- Conversion rate: If the feature is designed to drive a specific action (e.g., purchase, sign-up), track the percentage of users who complete that action after using the feature.
Analyzing the data and taking action
Once you've gathered data on your feature adoption metrics, it's time to analyze it. Here are some steps to follow:
- Identify trends: Look for patterns in user behavior across different metrics. Are there specific user groups with lower adoption rates? Are there any actions within the feature that lead to higher drop-off rates?
- Compare with expectations: How does your feature adoption data compare to your initial goals for the feature? Are you meeting your target engagement levels or conversion rates?
- Investigate the "whys": Use user feedback mechanisms (surveys, in-app feedback) and qualitative analysis to understand why users are not adopting the feature. Are they confused? Uninterested? Facing technical difficulties?
By analyzing the data and understanding the "whys" behind user behavior, you can take targeted actions to improve feature adoption.
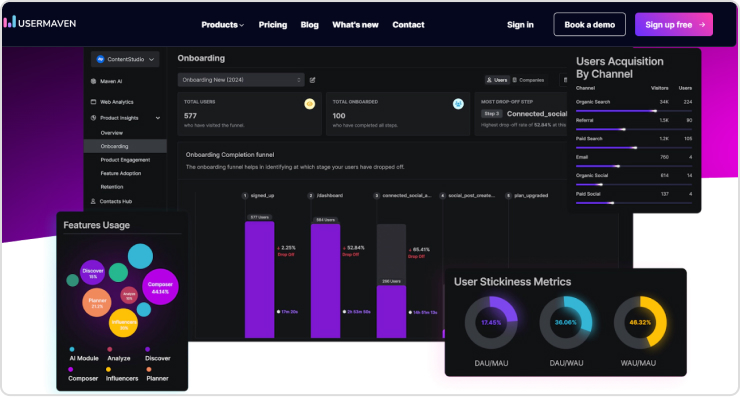
Example: Usermaven's feature adoption functionality goes beyond simply telling you if users are clicking on a new feature. It provides a deep dive into user engagement, uncovering how users interact with the feature itself. This lets you see if they're using it as intended, completing desired actions, or encountering roadblocks.
With these insights, you can identify which features resonate with users and prioritize improvements for those that don't. This data-driven approach ensures you're optimizing your product to maximize user engagement and satisfaction.
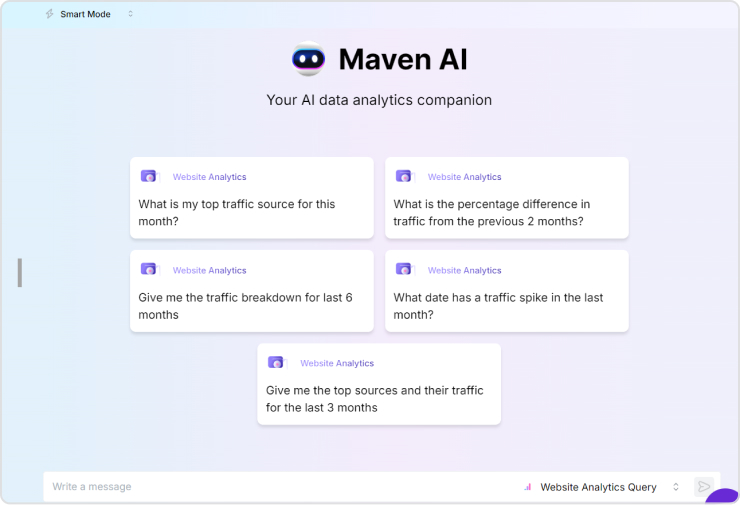
8. AI insights
Traditionally, product analytics has relied on quantitative data like user actions, clicks, and time spent on features. While valuable, this data can lack the qualitative depth to truly understand user behavior and motivations. This is where AI insights, specifically tools like Maven AI, can become a powerful addition to your product analytics toolbox.
What are AI insights (Maven AI)?
AI insights provide tools that use artificial intelligence to analyze website and product data. It goes beyond basic metrics by offering functionalities like:
- Natural language processing (NLP): This allows AI to understand the intent behind user actions and analyze textual data like reviews and feedback.
- Identifying hidden patterns: By sifting through vast amounts of data, AI can uncover trends and correlations that might be missed by human analysts.
- Actionable insights: It doesn't just provide data; it translates findings into clear, actionable recommendations for product improvement.
How can AI insights enhance product analytics?
By incorporating AI insights into your product analytics strategy, you can gain a deeper understanding of your users and their interactions with your product. Here's how:
- Uncover user sentiment: Analyze user reviews, feedback forms, and even chat transcripts to understand user satisfaction, identify pain points, and analyze overall product sentiment.
- Predict user behavior: By analyzing user actions and patterns, AI can predict future behavior and identify potential drop-off points. This allows you to proactively address issues and improve user retention.
- Personalize the user: AI can segment users based on their behavior and preferences, allowing you to personalize the user experience and cater to different user groups.
- Validate design decisions: Use AI insights to test the effectiveness of new features and design changes. See how users interact with them and identify areas for improvement before a full rollout.
By combining AI insights with traditional quantitative data, you can create a holistic picture of your product's performance and user behavior. This allows you to make data-driven decisions that optimize your product for user needs and achieve your business goals.
Example: AI insights offered by tools like Maven AI can be a valuable addition to your product analytics strategy. By providing a deeper understanding of user behavior and sentiment, it empowers you to make informed decisions that will ultimately lead to a more successful product.
How do I choose the right product analytics for my situation?
Choosing the right product analytics tool for your SaaS app is like picking the ideal teammate—it needs to complement your needs and empower you to achieve your goals.
So, without complicating the process, we will provide you with 5 easy steps or considerations you should make before making a decision to choose a product.
1. Needs assessment
- App complexity: A simple app might not require a feature-heavy analytics suite. Consider the features and functionalities of your app.
- Data requirements: What kind of data do you need to track? User behavior, feature usage, or conversion rates?
- Team expertise: Does your team have the technical know-how to utilize a complex tool, or do you need something more user-friendly?
2. Feature comparison
- Data tracking capabilities: Does the tool track the specific metrics you need (e.g., user actions, feature usage)?
- Reporting and visualization: How easily can you generate reports and visualize data? Are the dashboards clear and actionable?
- Integrations: Does the tool integrate with your existing marketing or CRM platforms?
3. Ease of use
- Learning curve: How quickly can your team learn to use the tool? Is the interface intuitive and user-friendly?
- Implementation effort: How easy is it to set up and integrate the tool with your app?
- Customer support: Does the product offer adequate customer support to answer your questions and troubleshoot any issues?
4. Budget
- Pricing model: Do they offer a free trial, or are there different tiers with varying features and costs?
- Scalability: Consider if the tool can scale with your growing user base and data volume.
5. Usermaven's strengths
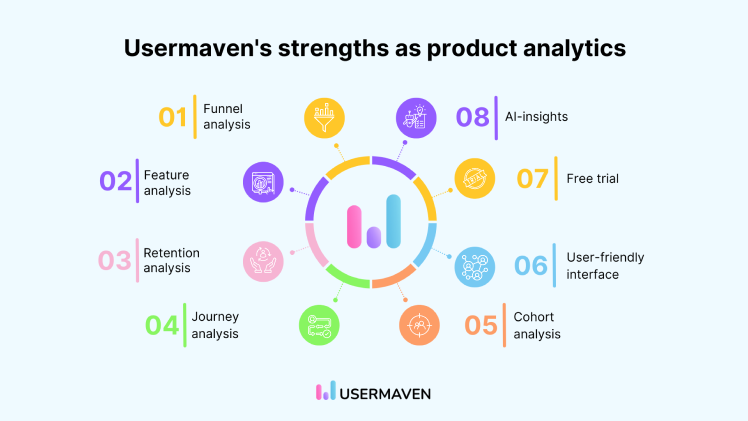
- Focus on user behavior: Usermaven goes beyond basic metrics to provide in-depth user behavior insights.
- Actionable data: Usermaven helps you understand not just what users do but why they do it.
- User-friendly interface: Our platform is designed to be intuitive and easy to use, even for non-technical teams.
- Free trial: Get started with a free trial and upgrade to a suitable plan later.
- AI-insights: Maven AI is a product offered by Usermaven that utilizes artificial intelligence to analyze website and product data.
In a nutshell
Product analytics helps you understand why users behave the way they do. By analyzing product analytics data, you can identify pain points and improve the user experience.
We have discussed important metrics that are necessary to understand for analyzing user behavior. There are a number of different tools that provide product insights; the best one depends on your needs and budget.
Usermaven is a product analytics tool that can help you track all of these metrics; you can try a free trial now!

FAQs
1. Is clicking enough? What else should product analytics track?
Clicks are a good starting point, but they don't tell the whole story. Product analytics should delve deeper into user journeys. This means tracking the entire flow a user takes within your product, from initial touchpoints to completing desired actions.
2. Can I do product analytics without expensive tools?
Absolutely! You can get started with product analytics without breaking the bank. Several tools like Usermaven provide pocket-friendly pricing options and free trials. You can choose a tool that best fits your budget and needs.
4. How do product analytics tools help businesses improve their products?
Product analytics tools help businesses improve their products by providing insights into user behavior, identifying conversion bottlenecks, enabling experimentation, and guiding data-driven decision-making for the product roadmap.

Know what's happening at every touchpoint of your users’ journey with AI-powered analytics.
It's 100% Free to Try!


